El Niño Southern Oscillation
What is measured
This indicator measures the El Niño Southern Oscillation (ENSO), the movement of warm equatorial water across the Pacific Ocean and the atmospheric response, using the Southern Oscillation Index (SOI). The SOI measures changes in atmospheric pressures across the Pacific.
We report the 3-month rolling average SOI alongside Aotearoa New Zealand’s detrended temperature anomaly for the period 1990 to 2022. We also provide data for the monthly average and 3-month rolling average SOI from 1876 to 2022, and New Zealand’s detrended temperature anomaly from 1909 to 2022. One or more consecutive three-month rolling average SOI are categorised by the National Institute of Water and Atmospheric Research (NIWA) (n.d.) as an El Niño phase for values at or below -1.0, and a La Niña phase for values at or above 1.0. See About the data for more details.
Why it is important
ENSO affects our weather through changes in air pressure, sea temperature, and wind direction. ENSO has three phases: neutral, El Niño, and La Niña. It influences rainfall, temperature, and wind patterns in New Zealand, and globally. In New Zealand an El Niño phase in summer can bring increased westerly winds, more rain in the west, and dryness in the east; in winter it can lead to more frequent, cooler southerly winds. During a La Niña phase we may experience more north-easterly winds, wetter conditions in the north and east, and higher sea levels. We can also experience warmer than average air and sea temperatures. ENSO is one of several climate oscillations that affect our weather (other oscillations include, but are not limited to, the Interdecadal Pacific Oscillation and the Southern Annular Mode). ENSO occurs every 2–7 years, typically lasting 6–18 months, with La Niña events typically persisting for longer periods than El Niño (NIWA, n.d.).
Download data

El Niño Southern Oscillation: Data to 2022 – CSV
ZIP compressed file, 13 KB
Key findings
Between 1990 and 2022:
- The most recent La Niña phase of the SOI was from April 2022 to December 2022, when average SOI values were at or above 1 – this was also the strongest La Niña since 1950 according to the three-month rolling SOI.
- The most recent El Niño phase of the SOI was from July 2015 to April 2016, when the three-month average SOI values were at or below -1.
- The two most recent strong El Niño episodes occurred in 1997–98 and 2015–16; the 1997–98 event developed in May 1997 and continued through May 1998 while the 2015–16 event developed in July 2015 and continued through April 2016 according to the three-month rolling SOI.
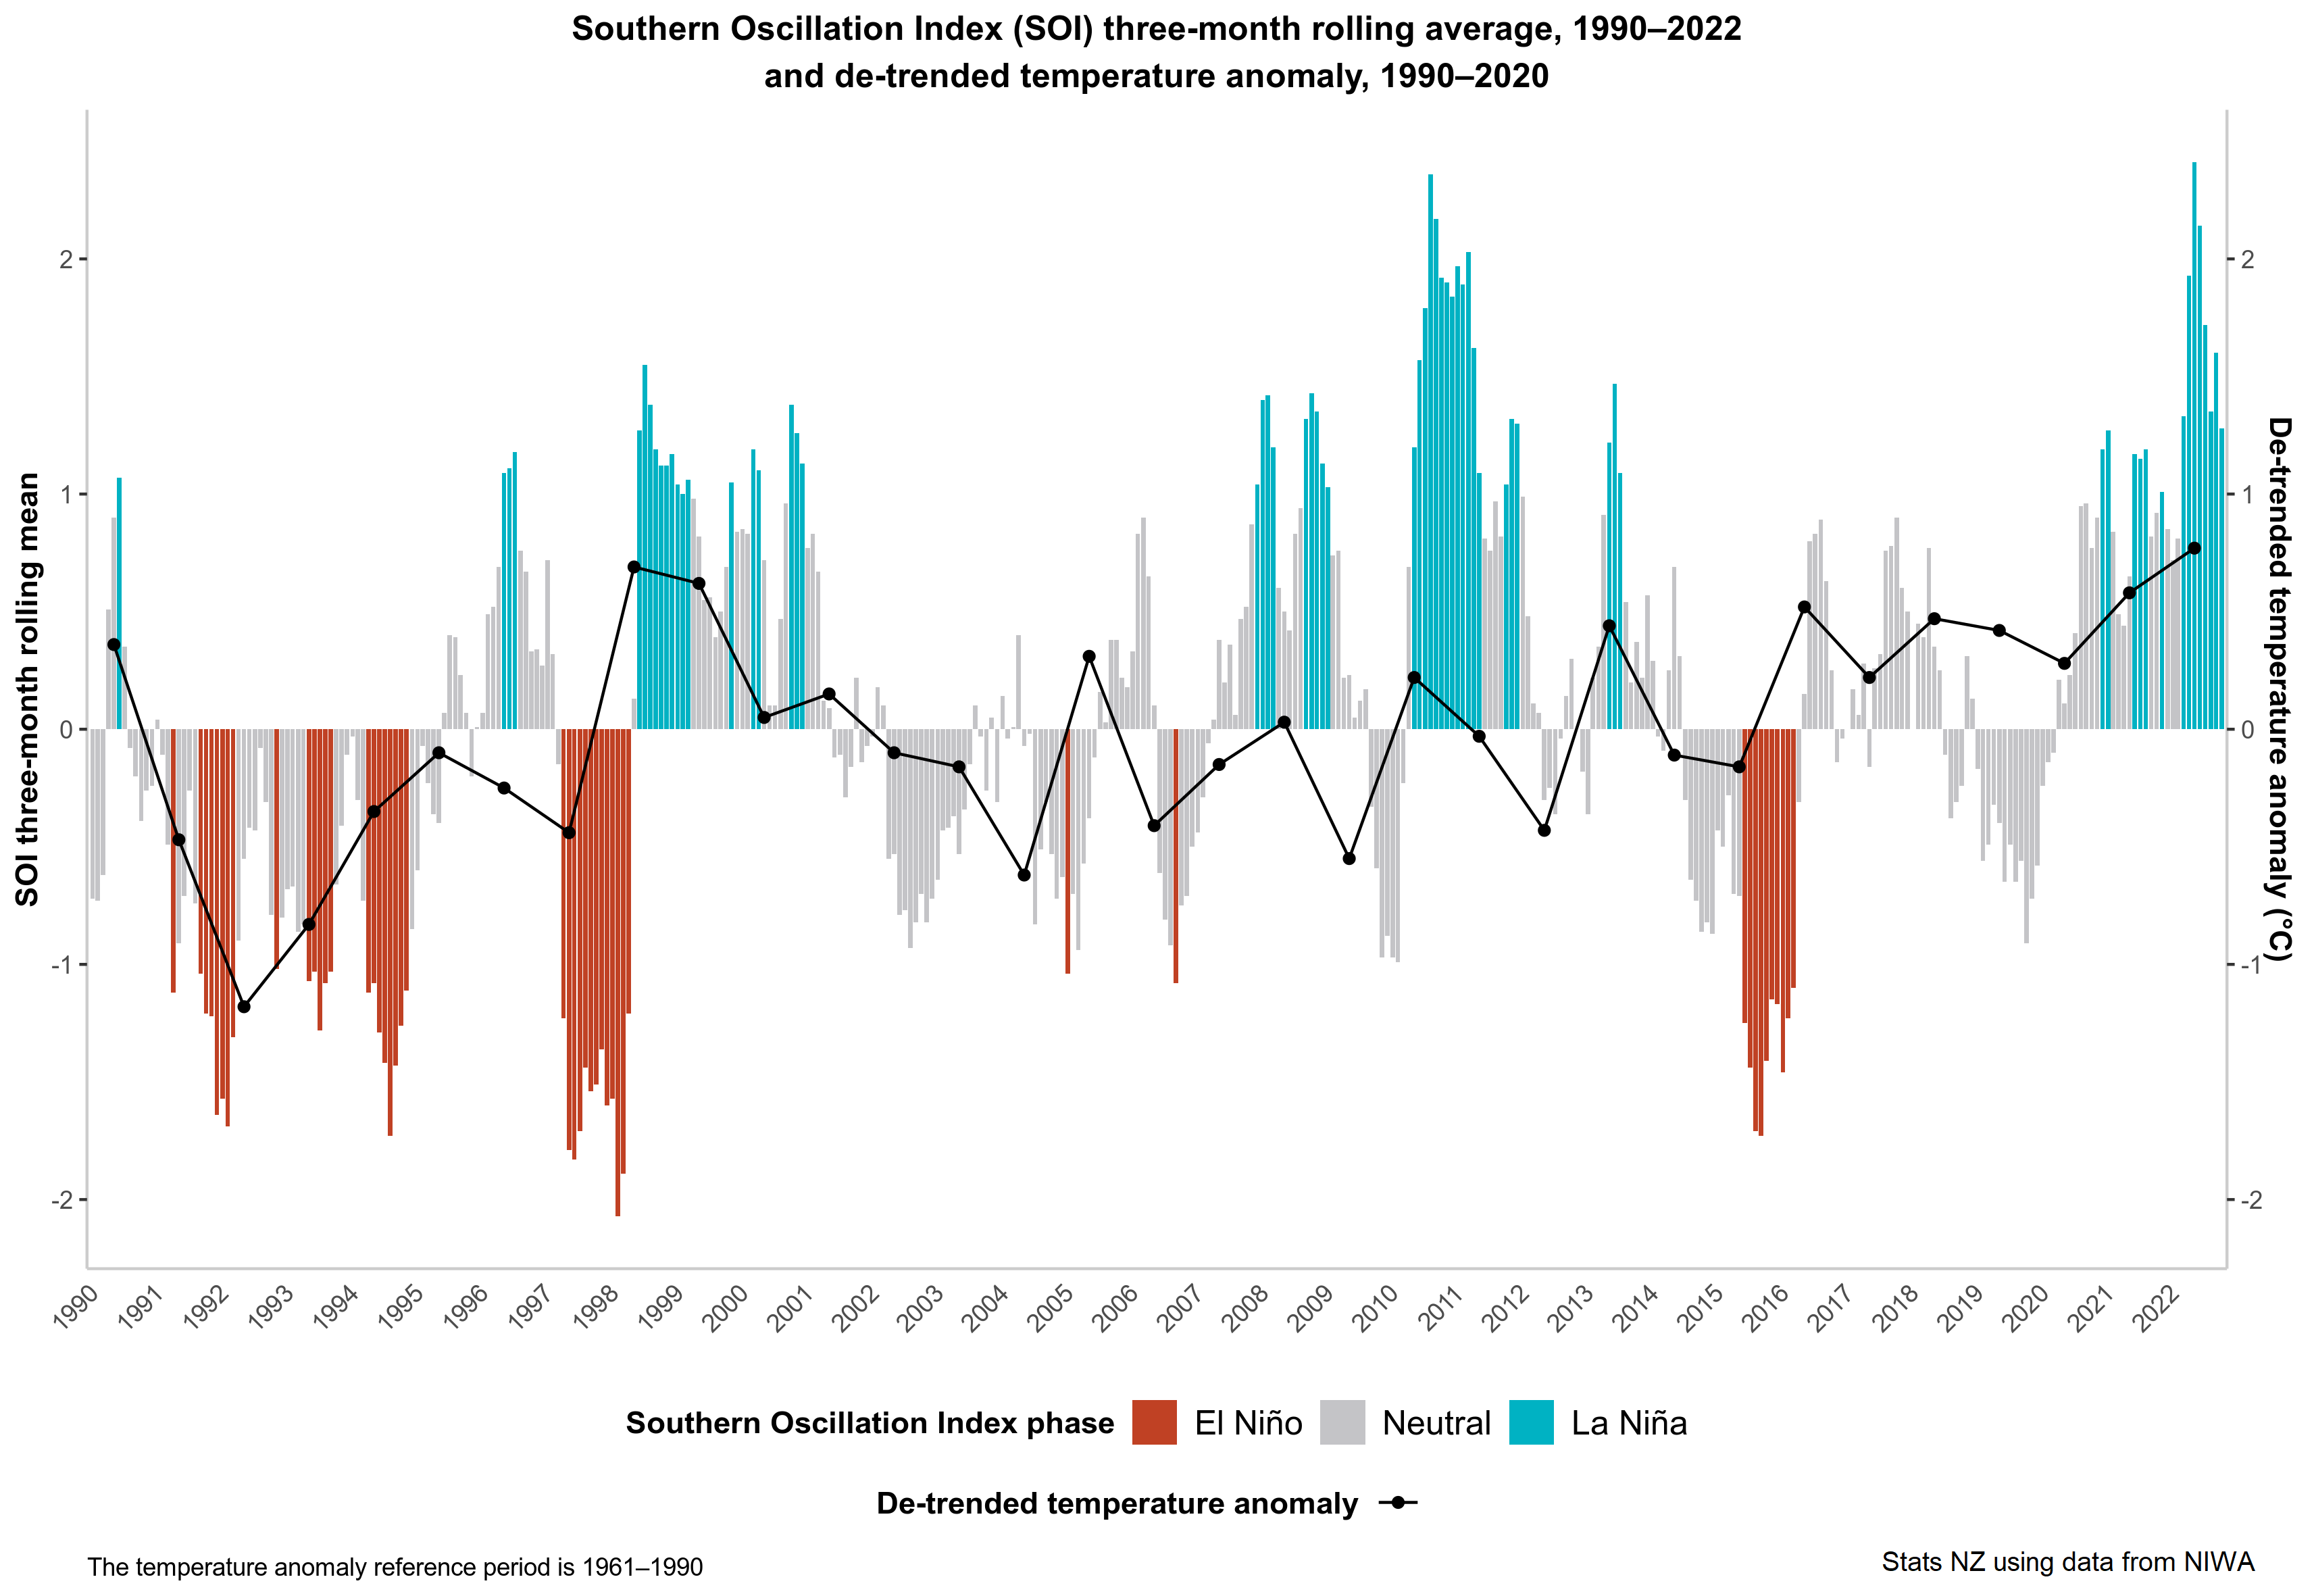
Text alternative for Southern Oscillation Index (SOI) three-month rolling average, 1990–2022 and de-trended temperature anomaly, 1990–2020
The column graph in this image shows the three-month rolling average of the SOI from 1990 to 2022, with columns shown in three colours that represent the different SOI phases. The brown columns indicate the data is from an El Niño phase, the teal columns indicate the data is from a La Niña phase, and the grey columns indicate the data is from a neutral phase. In addition to the column data, a black line represents the de-trended temperature anomaly from 1990 to 2020. The temperature anomaly reference period is 1961–1990. The data is available from SOI rolling average 1990–2022 and temperature anomaly 1990–2020 (CSV, 12 KB).
Where this data comes from
NIWA (National Institute of Water and Atmospheric Research)
View data tables
El Niño Southern Oscillation Index, 2016–2020 (added 29 January 2024)
Related indicators
Interdecadal Pacific Oscillation
Related content
Our atmosphere and climate 2023
Our atmosphere and climate 2020
Our atmosphere and climate 2017
Monthly atmospheric and SST indices
Technical report
Ministry for the Environment Atmosphere and Climate Report 2023: Updated Datasets supplied by NIWA
About the data
Several climate oscillations affect New Zealand, the key ones being:
- El Niño Southern Oscillation (ENSO) occurs every 2–7 years and typically lasts around a year.
- Southern Annular Mode can last for several weeks, but changes phases quickly and somewhat unpredictably.
- Interdecadal Pacific Oscillation (IPO) lasts 20–30 years.
The Southern Oscillation Index (SOI), which measures the atmospheric component of ENSO, is calculated from the difference between the standardised surface air pressures at Tahiti and Darwin (Australia), and represents the strength of the tropical trade winds. This difference is represented by a positive or negative SOI. For example, a negative SOI represents below normal air pressure at Tahiti and/or above normal air pressure at Darwin, and weaker than normal trade winds.
One or more consecutive three-month-rolling average SOI are categorised by NIWA (n.d.) as:
- a neutral El Niño Southern Oscillation phase for values between -0.5 and 0.5
- an El Niño phase for values at or below -1.0
- a La Niña phase for values at or above 1.0
- values between -0.5 and -1.0 lean toward El Niño, while values between 0.5 and 1.0 lean toward La Niña.
Atmosphere and climate 2023 – DataInfo+ provides further information on the SOI phases.
NIWA provided monthly SOI values for the period January 1876 to December 2022 using monthly Tahiti and Darwin mean sea level pressure (MSLP). For this release and according to best practice, these SOI values have been calculated using the latest 30-year MSLP baseline (1991–2020) to represent the modern climate normal. Climate normals serve as a benchmark against which recent or current observations can be compared (World Meteorological Organization, 2017). They can be used for determining how 'abnormal' the climate of a particular month, season, or year is when compared against the 30-year climate normal. Like air temperature and rainfall, ENSO behaviour and tendencies will change over time; the modern climate normal helps to keep up with those changes. Using the most recent climate normal may mean that borderline historical ENSO events now reach (or fail to reach) the threshold. Therefore, there are differences in the updated indicator data compared to the previous release data provided by NIWA in 2020 (Macara et al., 2020), which used a very long climatological window of 1941–2010. See Macara et al. (2023) for more detail on methods to calculate the SOI.
We provide data for the monthly and 3-month rolling average SOI from 1876 to 2022. We categorised SOI values following NIWA’s categorisation of the SOI oscillation phases (NIWA, n.d.).
Alongside the annual average SOI, we present New Zealand’s detrended annual average temperature anomaly (the difference from the climate baseline period, 1961 to 1990), calculated using NIWA’s ‘seven-station’ temperature series (see Temperature). Detrending removes the effects of the long-term trend from the data to help see variability and emphasise short-term changes. The detrended temperature is for the calendar year, beginning 1 January and ending 31 December the same year. We overlaid New Zealand’s detrended annual average temperature anomaly over the 3-month rolling average SOI to show the relationship between SOI and positive and negative temperature anomalies. The unusual drop in temperature in 1992 is associated with an El Niño period around that time and likely also the volcanic eruption at Mount Pinatubo, in the Philippines (Basher & Thompson, 1996).
Data quality
The accuracy of the data source is of high quality.
El Niño Southern Oscillation is a partial measure of the ‘Natural pressures’ topic.
Stats NZ and the Ministry for the Environment must report on topics related to the five environmental domains: air, atmosphere and climate, fresh water, land, and marine. These topics identify key issues within each domain.
Topics for environmental reporting describes the topics for each domain.
Data quality information has more information about the criteria we use to assess data quality.
References
Basher, R. E., & Thompson, C. S. (1996). Relationship of air temperatures in New Zealand to regional anomalies in sea‐surface temperature and atmospheric circulation. International Journal of Climatology, 16(4), 405–425. https://doi.org/10.1002/(SICI)1097-0088(199604)16:4<405::AID-JOC14>3.0.CO;2-T
Macara, G., Nichol, S., Liley, B., & Noll, B. (2023). Ministry for the Environment Atmosphere and Climate Indicators 2023: Updated Datasets supplied by NIWA (NIWA Client Report No. 2023072WN). https://environment.govt.nz/publications/atmosphere-and-climate-indicators-2023-updated-datasets
Macara, G., Nichol, S., Sutherland, D., Liley, B., Paul, V., & Srinivasan, R. (2020). Ministry for the Environment Atmosphere and Climate Report 2020: Updated Datasets supplied by NIWA (NIWA Client Report No. 2020100WN). https://www.mfe.govt.nz/publications/environmental-reporting/ministry-environment-atmosphere-and-climate-report-2020-updated
National Institute of Water and Atmospheric Research. (n.d.). El Niño and La Niña. https://niwa.co.nz/climate/information-and-resources/elnino
World Meteorological Organization. (2017). WMO guidelines on the calculation of climate normals (WMO-No. 1203). https://library.wmo.int/doc_num.php?explnum_id=4166
Archived pages
Archived September 2023: