Stats NZ

Overseas merchandise trade: July 2024

Overseas merchandise trade statistics provide information on imports and exports of merchandise goods between New Zealand and other countries.

Key facts

This release refers to trade in goods only.

In July 2024, compared with July 2023:

  • goods exports rose by $770 million (14 percent), to $6.1 billion
  • goods imports rose by $558 million (8.5 percent), to $7.1 billion
  • the monthly trade balance was a deficit of $963 million.
Created with Highcharts 5.0.14$Merchandise trade values ($), exports and imports, July months, 2004–2024ExportsImports20042005200620072008200920102011201220132014201520162017201820192020202120222023202402B4B6B8BStats NZ

Merchandise trade values ($), exports and imports, July months, 2004–2024

Created with Highcharts 5.0.14$Merchandise trade values ($), exports and imports, July months, 2004–2024ExportsImports20042005200620072008200920102011201220132014201520162017201820192020202120222023202402.5B5B7.5B10BStats NZ
YearExportsImports
20042,465,247,3312,849,368,118
20052,426,263,4343,050,411,346
20063,020,356,1053,713,824,251
20072,640,668,7833,448,204,459
20083,431,915,4824,229,035,708
20093,172,680,6343,350,262,864
20103,553,375,8073,739,362,422
20113,707,599,5153,604,683,215
20124,044,069,0953,946,531,863
20133,827,899,6444,616,006,147
20143,684,319,9494,626,853,657
20154,168,609,7734,899,053,730
20163,965,353,7504,316,781,555
20174,620,635,3694,528,608,020
20185,336,644,0405,539,754,373
20194,921,539,7465,653,875,143
20204,957,020,5244,569,258,728
20215,777,687,4066,164,845,908
20226,338,147,0827,753,339,153
20235,377,648,6386,551,797,681
20246,147,419,9237,110,196,956

Diagram showing goods exports and imports, July 2024 month compared with July 2023 month. Text alternative available below diagram.

Text alternative for Goods exports and imports, July 2024 month compared with July 2023 month

Exports

Goods exports rose by $770 million (14 percent) in July 2024 (to $6.1 billion), compared with July 2023.

Milk powder, butter, and cheese lead exports rise

Milk powder, butter, and cheese rose $155 million (11 percent), to $1.6 billion.

Changes in exports of milk powder, butter, and cheese, July 2023 to July 2024


July 2024 value
($ million)

Change in value
($ million)

Change
in value

Change
in quantity

Change in
unit price

Milk powder, butter,
and cheese

1,608

155

11%

*

*

Milk powder

685

81

13%

12%

1.1%

Milk fats (including butter)

405

40

11%

-14%

29%

Cheese

293

36

14%

24%

-7.8%

Fresh milk and cream

113

23

25%

*

*

* Changes in total quantity and unit price are omitted due to differences in units of measure.


Other dairy-based products, including infant formula rose this period, and casein and caseinates fell during this period.


July 2024 value
($ million)

Change in value
($ million)

Change
in value

Change
in quantity

Change
in unit price

Infant formula

171

100

140%

116%

11%

Casein and caseinates

163

-13

-7.5%

24%

-25%


Infant formula is included in preparations of milk, cereals, flour, and starch, which rose $108 million (86 percent) to $235 million.

Fruit, up $135 million (28 percent) to $609 million. This was led by kiwifruit, which rose $100 million (29 percent) to $449 million.

Created with Highcharts 5.0.14$Kiwifruit export values ($), March–July months, 2015–202420152016201720182019202020212022202320240500M1 000M1 500M2 000M2 500MStats NZ

Kiwifruit export values ($), March–July months, 2015–2024

Created with Highcharts 5.0.14$Kiwifruit export values ($), March–July months, 2015–2024Value201520162017201820192020202120222023202401B2B3BStats NZ
YearValue
2015955,963,426
20161,157,442,022
20171,184,420,386
20181,400,071,679
20191,582,003,227
20201,890,718,092
20211,885,707,801
20221,954,102,411
20231,905,371,281
20242,445,947,614

Top monthly export movements by country

The monthly movements in July 2024, compared with July 2023, for our top export partners (in order of total annual goods exports) were:

  • China: total exports were up $107 million (8.5 percent).
    • The largest rises were fruit, up $76 million; preparations of milk, cereals, flour, and starch, up $53 million; and logs, wood, and wood articles, up $52 million.
    • The largest falls were meat and edible offal, down $83 million; and wood pulp and waste paper, down $12 million.
  • Australia: total exports were up $135 million (19 percent).
    • The largest rises were crude oil, up $72 million; miscellaneous edible preparations, up $21 million; and precious metals, jewellery, and coins, up $20 million.
    • The largest fall was vehicles, parts, and accessories, down $16 million.
  • USA: total exports were up $35 million (4.7 percent).
    • The largest rises were wine, up $18 million; fruit, up $17 million; and optical, medical, and measuring equipment, up $11 million.
    • The largest falls were milk powder, butter, and cheese, down $29 million; and mechanical machinery and equipment, down $15 million.
  • EU: total exports were up $114 million (30 percent).
    • The largest rises were fruit, up $42 million; aluminium and aluminium articles, up $14 million; and pharmaceutical products, up $12 million.
    • There were no significant falls over $10 million.
  • Japan: total exports were up $17 million (5.3 percent).
    • The largest rise was aluminium and aluminium articles, up $14 million.
    • There were no significant falls over $10 million.

Imports

Goods imports rose by $558 million (8.5 percent), in July 2024 (to $7.1 billion), compared with July 2023.

Petroleum and products lead the rise in imports

Petroleum and products rose by $664 million (101 percent), to $1.3 billion.


July 2024 value
($ million)

Change in value
($ million)

Change
in value

Change
in quantity

Change in
unit price

Petroleum and
products**

1,323

664

101%

*

*

Diesel

502

221

79%

63%

9.3%

Petrol

573

342

148%

*

*

Jet fuel

193

107

125%

106%

9.6%

* Changes in total quantity and unit price are omitted due to differences in units of measure.

**Imports of petroleum and products fluctuate month to month based on individual large movements.


Vehicles, parts, and accessories fell $217 million (22 percent) to $776 million. This was led by passenger cars that fell $165 million (27 percent) to $456 million, which was in turn led by electric passenger cars that fell $112 million (81 percent) to $26 million.

Created with Highcharts 5.0.14$Electric passenger car imports ($), monthly, January 2019–July 2024Jan-19Mar-19May-19Jul-19Sep-19Nov-19Jan-20Mar-20May-20Jul-20Sep-20Nov-20Jan-21Mar-21May-21Jul-21Sep-21Nov-21Jan-22Mar-22May-22Jul-22Sep-22Nov-22Jan-23Mar-23May-23Jul-23Sep-23Nov-23Jan-24Mar-24May-24Jul-24050M100M150M200M250MStats NZ

Electric passenger car imports ($), monthly, January 2019–July 2024

Created with Highcharts 5.0.14$Electric passenger car imports ($), monthly, January 2019–July 2024ValueJan-19Mar-19May-19Jul-19Sep-19Nov-19Jan-20Mar-20May-20Jul-20Sep-20Nov-20Jan-21Mar-21May-21Jul-21Sep-21Nov-21Jan-22Mar-22May-22Jul-22Sep-22Nov-22Jan-23Mar-23May-23Jul-23Sep-23Nov-23Jan-24Mar-24May-24Jul-240100M200M300MStats NZ
MonthValue
Jan-199,788,391
Feb-1914,670,947
Mar-196,479,815
Apr-196,924,216
May-1917,731,923
Jun-1910,576,605
Jul-199,819,992
Aug-1930,821,588
Sep-1934,860,249
Oct-1913,846,611
Nov-1925,569,271
Dec-1914,378,171
Jan-209,031,782
Feb-2011,138,997
Mar-2012,180,462
Apr-205,161,343
May-202,944,847
Jun-206,084,079
Jul-204,828,290
Aug-2015,935,455
Sep-2012,585,278
Oct-209,879,203
Nov-208,203,708
Dec-209,902,453
Jan-219,588,082
Feb-2120,503,473
Mar-2127,311,124
Apr-2117,650,037
May-2151,163,142
Jun-2130,660,298
Jul-2141,803,708
Aug-2149,001,622
Sep-2153,431,695
Oct-2129,950,384
Nov-2170,218,164
Dec-2139,902,837
Jan-2248,444,957
Feb-2269,078,373
Mar-2241,730,320
Apr-2235,016,356
May-2249,731,679
Jun-2246,481,623
Jul-22153,919,585
Aug-2264,855,408
Sep-22136,572,473
Oct-22133,473,998
Nov-22221,704,318
Dec-2257,197,938
Jan-2368,764,371
Feb-23138,147,181
Mar-23109,087,661
Apr-2374,185,026
May-23151,780,134
Jun-2356,724,017
Jul-23138,306,073
Aug-23108,099,405
Sep-23136,808,865
Oct-23107,236,217
Nov-2397,521,359
Dec-2363,073,868
Jan-2473,119,247
Feb-2439,842,361
Mar-2437,510,766
Apr-2426,051,314
May-2445,624,306
Jun-2440,280,479
Jul-2425,896,762

Top monthly import movements by country

The monthly movements in July 2024, compared with July 2023, for our top import partners (in order of total annual goods imports) were:

  • China: total imports were up $233 million (18 percent).
    • The largest rises were petroleum and products, up $50 million; textiles and textile articles, up $27 million; and electrical machinery and equipment, up $27 million.
    • The largest falls were vehicles, parts, and accessories, down $20 million; and railway, down $17 million.
  • EU: total imports were down $147 million (14 percent).
    • The largest rises were pharmaceutical products, up $21 million; and ships, boats, and floating structures, up $12 million.
    • The largest falls were vehicles, parts, and accessories, down $159 million; and mechanical machinery and equipment, down $10 million.
  • Australia: total imports were up $6.3 million (0.82 percent).
    • The largest rises were inorganic chemicals, up $14 million; and vehicles, parts, and accessories, up $12 million.
    • The largest falls were salt, earths, stone, lime, and cement, down $14 million; and fertilisers, down $13 million.
  • USA: total imports were down $255 million (30 percent).
    • The largest rises were mechanical machinery and equipment, up $16 million; and electrical machinery and equipment, up $16 million.
    • The largest falls were aircraft and parts, down $261 million; vehicles, parts, and accessories, down $20 million; and food residues, wastes, and fodder, down $16 million.
  • South Korea: total imports were up $480 million (103 percent).
    • The largest rise was petroleum and products, up $481 million.
    • The largest fall was fertilisers, down $17 million.

Trade deficit in July 2024

The monthly trade balance was a deficit of $963 million.

Created with Highcharts 5.0.14$Monthly trade balance ($), July 2015–July 2024Jul-15Sep-15Nov-15Jan-16Mar-16May-16Jul-16Sep-16Nov-16Jan-17Mar-17May-17Jul-17Sep-17Nov-17Jan-18Mar-18May-18Jul-18Sep-18Nov-18Jan-19Mar-19May-19Jul-19Sep-19Nov-19Jan-20Mar-20May-20Jul-20Sep-20Nov-20Jan-21Mar-21May-21Jul-21Sep-21Nov-21Jan-22Mar-22May-22Jul-22Sep-22Nov-22Jan-23Mar-23May-23Jul-23Sep-23Nov-23Jan-24Mar-24May-24Jul-24-3B-2B-1B01B2BStats NZ

Monthly trade balance ($), July 2015–July 2024

Created with Highcharts 5.0.14$Monthly trade balance ($), July 2015–July 2024Trade balanceJul-15Sep-15Nov-15Jan-16Mar-16May-16Jul-16Sep-16Nov-16Jan-17Mar-17May-17Jul-17Sep-17Nov-17Jan-18Mar-18May-18Jul-18Sep-18Nov-18Jan-19Mar-19May-19Jul-19Sep-19Nov-19Jan-20Mar-20May-20Jul-20Sep-20Nov-20Jan-21Mar-21May-21Jul-21Sep-21Nov-21Jan-22Mar-22May-22Jul-22Sep-22Nov-22Jan-23Mar-23May-23Jul-23Sep-23Nov-23Jan-24Mar-24May-24Jul-24-3B-2B-1B01B2BStats NZ
MonthTrade balance
Jul-15-730,443,957
Aug-15-1,090,170,040
Sep-15-1,140,014,218
Oct-15-904,822,585
Nov-15-795,426,228
Dec-15-41,905,853
Jan-1612,320,231
Feb-16366,925,311
Mar-16188,849,850
Apr-16349,530,073
May-16343,078,843
Jun-16106,790,388
Jul-16-351,427,805
Aug-16-1,239,891,851
Sep-16-1,387,987,389
Oct-16-797,651,150
Nov-16-723,201,112
Dec-16-1,435,171
Jan-17-226,543,047
Feb-17-42,276,469
Mar-17261,589,138
Apr-17546,879,922
May-1762,020,162
Jun-17243,117,487
Jul-1792,027,349
Aug-17-1,174,342,582
Sep-17-1,165,209,854
Oct-17-839,633,458
Nov-17-1,222,417,301
Dec-17614,310,559
Jan-18-662,421,494
Feb-18188,256,546
Mar-18-150,609,406
Apr-18199,745,211
May-18199,288,004
Jun-18-285,260,079
Jul-18-203,110,333
Aug-18-1,566,757,996
Sep-18-1,579,921,712
Oct-18-1,305,105,133
Nov-18-1,003,973,060
Dec-189,286,883
Jan-19-934,926,531
Feb-19-93,584,137
Mar-19825,181,314
Apr-19360,963,002
May-19174,927,698
Jun-19329,812,747
Jul-19-732,335,397
Aug-19-1,641,634,097
Sep-19-1,309,937,148
Oct-19-1,038,380,593
Nov-19-786,493,088
Dec-19379,772,255
Jan-20-395,635,011
Feb-20550,639,307
Mar-20522,807,892
Apr-201,374,019,783
May-201,222,702,687
Jun-20416,538,602
Jul-20387,761,796
Aug-20-320,606,284
Sep-20-1,132,334,429
Oct-20-465,913,506
Nov-20679,104
Dec-20230,069,561
Jan-21-729,765,438
Feb-21449,847,010
Mar-21-182,555,509
Apr-21557,914,991
May-21404,936,125
Jun-21442,108,253
Jul-21-387,158,502
Aug-21-2,132,508,281
Sep-21-2,166,033,786
Oct-21-1,282,573,004
Nov-21-1,085,761,728
Dec-21-990,246,456
Jan-22-1,106,744,295
Feb-22-714,801,157
Mar-22-593,488,596
Apr-22469,495,559.5
May-22148,263,036
Jun-22-1,132,868,318
Jul-22-1,415,192,071
Aug-22-2,634,137,110
Sep-22-2,519,671,472
Oct-22-2,315,527,621
Nov-22-2,183,787,239
Dec-22-650,530,508
Jan-23-2,095,237,898
Feb-23-846,757,630
Mar-23-1,602,490,156
Apr-23220,854,073
May-2341,615,990.2
Jun-23-114,738,381
Jul-23-1,174,149,043
Aug-23-2,266,681,329
Sep-23-2,420,838,856
Oct-23-1,732,504,563
Nov-23-1,258,971,689
Dec-23-372,771,305
Jan-24-1,064,170,538
Feb-24-318,989,147
Mar-24469,883,412
Apr-24-11,882,445
May-2461,682,554
Jun-24585,357,633
Jul-24-962,777,033

July 2024 year

Annual values are actual and compared with the year ended July 2023.

  • Annual goods exports were valued at $69.4 billion, down $2.4 billion from the previous year.
  • Annual goods imports were valued at $78.6 billion, down $8.9 billion from the previous year.
  • The annual trade deficit was $9.3 billion. In the year ended July 2023, the annual trade deficit was $15.8 billion.
Created with Highcharts 5.0.14Exports and imports ($)Trade balance ($)Annual exports and imports ($), trade balance ($), year ended, July 2015–July 2024Trade balanceExportsImportsJul-15Sep-15Nov-15Jan-16Mar-16May-16Jul-16Sep-16Nov-16Jan-17Mar-17May-17Jul-17Sep-17Nov-17Jan-18Mar-18May-18Jul-18Sep-18Nov-18Jan-19Mar-19May-19Jul-19Sep-19Nov-19Jan-20Mar-20May-20Jul-20Sep-20Nov-20Jan-21Mar-21May-21Jul-21Sep-21Nov-21Jan-22Mar-22May-22Jul-22Sep-22Nov-22Jan-23Mar-23May-23Jul-23Sep-23Nov-23Jan-24Mar-24May-24Jul-2424B48B72B96B120B-24B-18B-12B-6B06BStats NZ

Annual exports and imports ($), trade balance ($), year ended, July 2015–July 2024

Created with Highcharts 5.0.14Exports and imports ($)Annual exports and imports ($), trade balance ($), year ended, July 2015–July 2024Trade balanceExportsImportsJul-15Sep-15Nov-15Jan-16Mar-16May-16Jul-16Sep-16Nov-16Jan-17Mar-17May-17Jul-17Sep-17Nov-17Jan-18Mar-18May-18Jul-18Sep-18Nov-18Jan-19Mar-19May-19Jul-19Sep-19Nov-19Jan-20Mar-20May-20Jul-20Sep-20Nov-20Jan-21Mar-21May-21Jul-21Sep-21Nov-21Jan-22Mar-22May-22Jul-22Sep-22Nov-22Jan-23Mar-23May-23Jul-23Sep-23Nov-23Jan-24Mar-24May-24Jul-24120B30B60B90B-24B0-16B-8B8BStats NZ
YearTrade balanceExportsImports
Jul-15-2,762,446,24948,880,453,00551,642,899,254
Aug-15-3,388,079,71349,057,455,49552,445,535,208
Sep-15-3,169,130,89749,117,987,19952,287,118,096
Oct-15-3,182,409,61848,918,947,18752,101,356,805
Nov-15-3,694,857,47748,952,719,87552,647,577,352
Dec-15-3,536,562,99448,973,550,77652,510,113,770
Jan-16-3,576,399,41649,187,466,08552,763,865,501
Feb-16-3,293,445,74749,537,612,56752,831,058,314
Mar-16-3,765,397,25748,833,243,76352,598,641,020
Apr-16-3,599,939,05749,026,536,18352,626,475,240
May-16-3,624,030,73649,230,155,44652,854,186,182
Jun-16-3,335,288,18549,324,864,24352,660,152,428
Jul-16-2,956,272,03349,121,608,22052,077,880,253
Aug-16-3,105,993,84448,793,893,78651,899,887,630
Sep-16-3,353,967,01548,583,604,24151,937,571,256
Oct-16-3,246,795,58048,696,300,60251,943,096,182
Nov-16-3,174,570,46448,493,856,23451,668,426,698
Dec-16-3,134,099,78248,486,904,07851,621,003,860
Jan-17-3,372,963,06048,527,688,85351,900,651,913
Feb-17-3,782,164,84048,305,011,95452,087,176,794
Mar-17-3,709,425,55248,694,076,73952,403,502,291
Apr-17-3,512,075,70349,076,148,83052,588,224,533
May-17-3,793,134,38449,424,472,30153,217,606,685
Jun-17-3,656,807,28549,873,491,50853,530,298,793
Jul-17-3,213,352,13150,528,773,12753,742,125,258
Aug-17-3,147,802,86250,834,401,32853,982,204,190
Sep-17-2,925,025,32751,160,043,92954,085,069,256
Oct-17-2,967,007,63551,791,672,04154,758,679,676
Nov-17-3,466,223,82452,532,859,58855,999,083,412
Dec-17-2,850,478,09453,625,488,16156,475,966,255
Jan-18-3,286,356,54153,965,184,42057,251,540,961
Feb-18-3,055,823,52654,395,355,68257,451,179,208
Mar-18-3,468,022,07054,602,966,05158,070,988,121
Apr-18-3,815,156,78154,860,205,15158,675,361,932
May-18-3,677,888,93955,304,076,43358,981,965,372
Jun-18-4,206,266,50555,490,192,91659,696,459,421
Jul-18-4,501,404,18756,206,201,58760,707,605,774
Aug-18-4,893,819,60156,493,336,02261,387,155,623
Sep-18-5,308,531,45956,954,044,26162,262,575,720
Oct-18-5,774,003,13457,226,558,63763,000,561,771
Nov-18-5,555,558,89357,470,599,03763,026,157,930
Dec-18-6,160,582,56957,251,104,26563,411,686,834
Jan-19-6,433,087,60657,320,341,20763,753,428,813
Feb-19-6,714,928,28957,583,937,30264,298,865,591
Mar-19-5,739,137,56958,386,241,76464,125,379,333
Apr-19-5,577,919,77858,900,924,29664,478,844,074
May-19-5,602,280,08459,293,597,15764,895,877,241
Jun-19-4,987,207,25859,378,412,55164,365,619,809
Jul-19-5,516,432,32258,963,308,25764,479,740,579
Aug-19-5,591,308,42359,050,318,14164,641,626,564
Sep-19-5,321,323,85959,153,331,44664,474,655,305
Oct-19-5,054,599,31959,330,562,86364,385,162,182
Nov-19-4,837,119,34759,689,705,16364,526,824,510
Dec-19-4,466,633,97559,899,236,28164,365,870,256
Jan-20-3,927,342,45560,232,430,77264,159,773,227
Feb-20-3,283,119,01160,412,604,75163,695,723,762
Mar-20-3,585,492,43360,424,643,72864,010,136,161
Apr-20-2,572,435,65260,267,881,08562,840,316,737
May-20-1,524,660,66359,860,029,86261,384,690,525
Jun-20-1,437,934,80859,923,371,34961,361,306,157
Jul-20-317,837,61559,958,852,12760,276,689,742
Aug-201,003,190,19860,267,415,95059,264,225,752
Sep-201,180,792,91759,811,824,50558,631,031,588
Oct-201,753,260,00459,608,519,26657,855,259,262
Nov-202,540,432,19659,310,670,09456,770,237,898
Dec-202,390,729,50259,352,090,26856,961,360,766
Jan-212,056,599,07558,791,158,73256,734,559,657
Feb-211,955,806,77858,648,923,03956,693,116,261
Mar-211,250,443,37758,509,007,52957,258,564,152
Apr-21434,338,58558,727,983,91258,293,645,327
May-21-383,427,97759,187,764,62259,571,192,599
Jun-21-357,858,32660,317,064,34560,674,922,671
Jul-21-1,132,778,62461,137,731,22762,270,509,851
Aug-21-2,944,680,62161,130,377,63264,075,058,253
Sep-21-3,978,379,97861,626,437,40465,604,817,382
Oct-21-4,795,039,47662,203,301,84066,998,341,316
Nov-21-5,881,480,30862,957,144,84668,838,625,154
Dec-21-7,101,796,32563,494,172,02370,595,968,348
Jan-22-7,478,775,18264,179,336,42071,658,111,602
Feb-22-8,643,423,34964,623,309,41473,266,732,763
Mar-22-9,054,356,43665,620,086,36474,674,442,800
Apr-22-9,142,775,86766,238,532,81175,381,308,679
May-22-9,399,448,95667,249,624,54976,649,073,506
Jun-22-10,974,425,52867,320,451,69678,294,877,224
Jul-22-12,002,459,09767,880,911,37279,883,370,469
Aug-22-12,504,087,92668,799,762,32381,303,850,249
Sep-22-12,857,725,61270,313,919,97383,171,645,585
Oct-22-13,890,680,22970,886,872,31484,777,552,543
Nov-22-14,988,705,74071,544,229,91986,532,935,659
Dec-22-14,648,989,79271,970,611,82186,619,601,613
Jan-23-15,637,483,39572,476,808,67288,114,292,067
Feb-23-15,769,439,86872,353,029,89888,122,469,766
Mar-23-16,778,441,42872,141,630,25888,920,071,686
Apr-23-17,027,082,91472,569,483,05289,596,565,966
May-23-17,133,729,96072,717,557,73189,851,287,691
Jun-23-16,115,600,02372,672,011,43188,787,611,454
Jul-23-15,874,556,99571,711,512,98787,586,069,982
Aug-23-15,507,101,21471,402,878,99286,909,980,206
Sep-23-15,408,268,59870,258,409,95585,666,678,553
Oct-23-14,825,245,54069,672,337,56584,497,583,105
Nov-23-13,900,429,99069,280,620,30183,181,050,291
Dec-23-13,622,670,78768,620,962,13382,243,632,920
Jan-24-12,591,603,42768,136,465,01380,728,068,440
Feb-24-12,063,834,94468,854,669,18180,918,504,125
Mar-24-9,991,461,37668,969,169,69378,960,631,069
Apr-24-10,224,197,89468,673,149,21178,897,347,105
May-24-10,204,131,33068,722,034,33678,926,165,666
Jun-24-9,504,035,31668,581,601,81178,085,637,127
Jul-24-9,292,663,30669,351,373,09678,644,036,402

Text alternative for Goods exports and imports, July 2024 month compared with July 2023 month

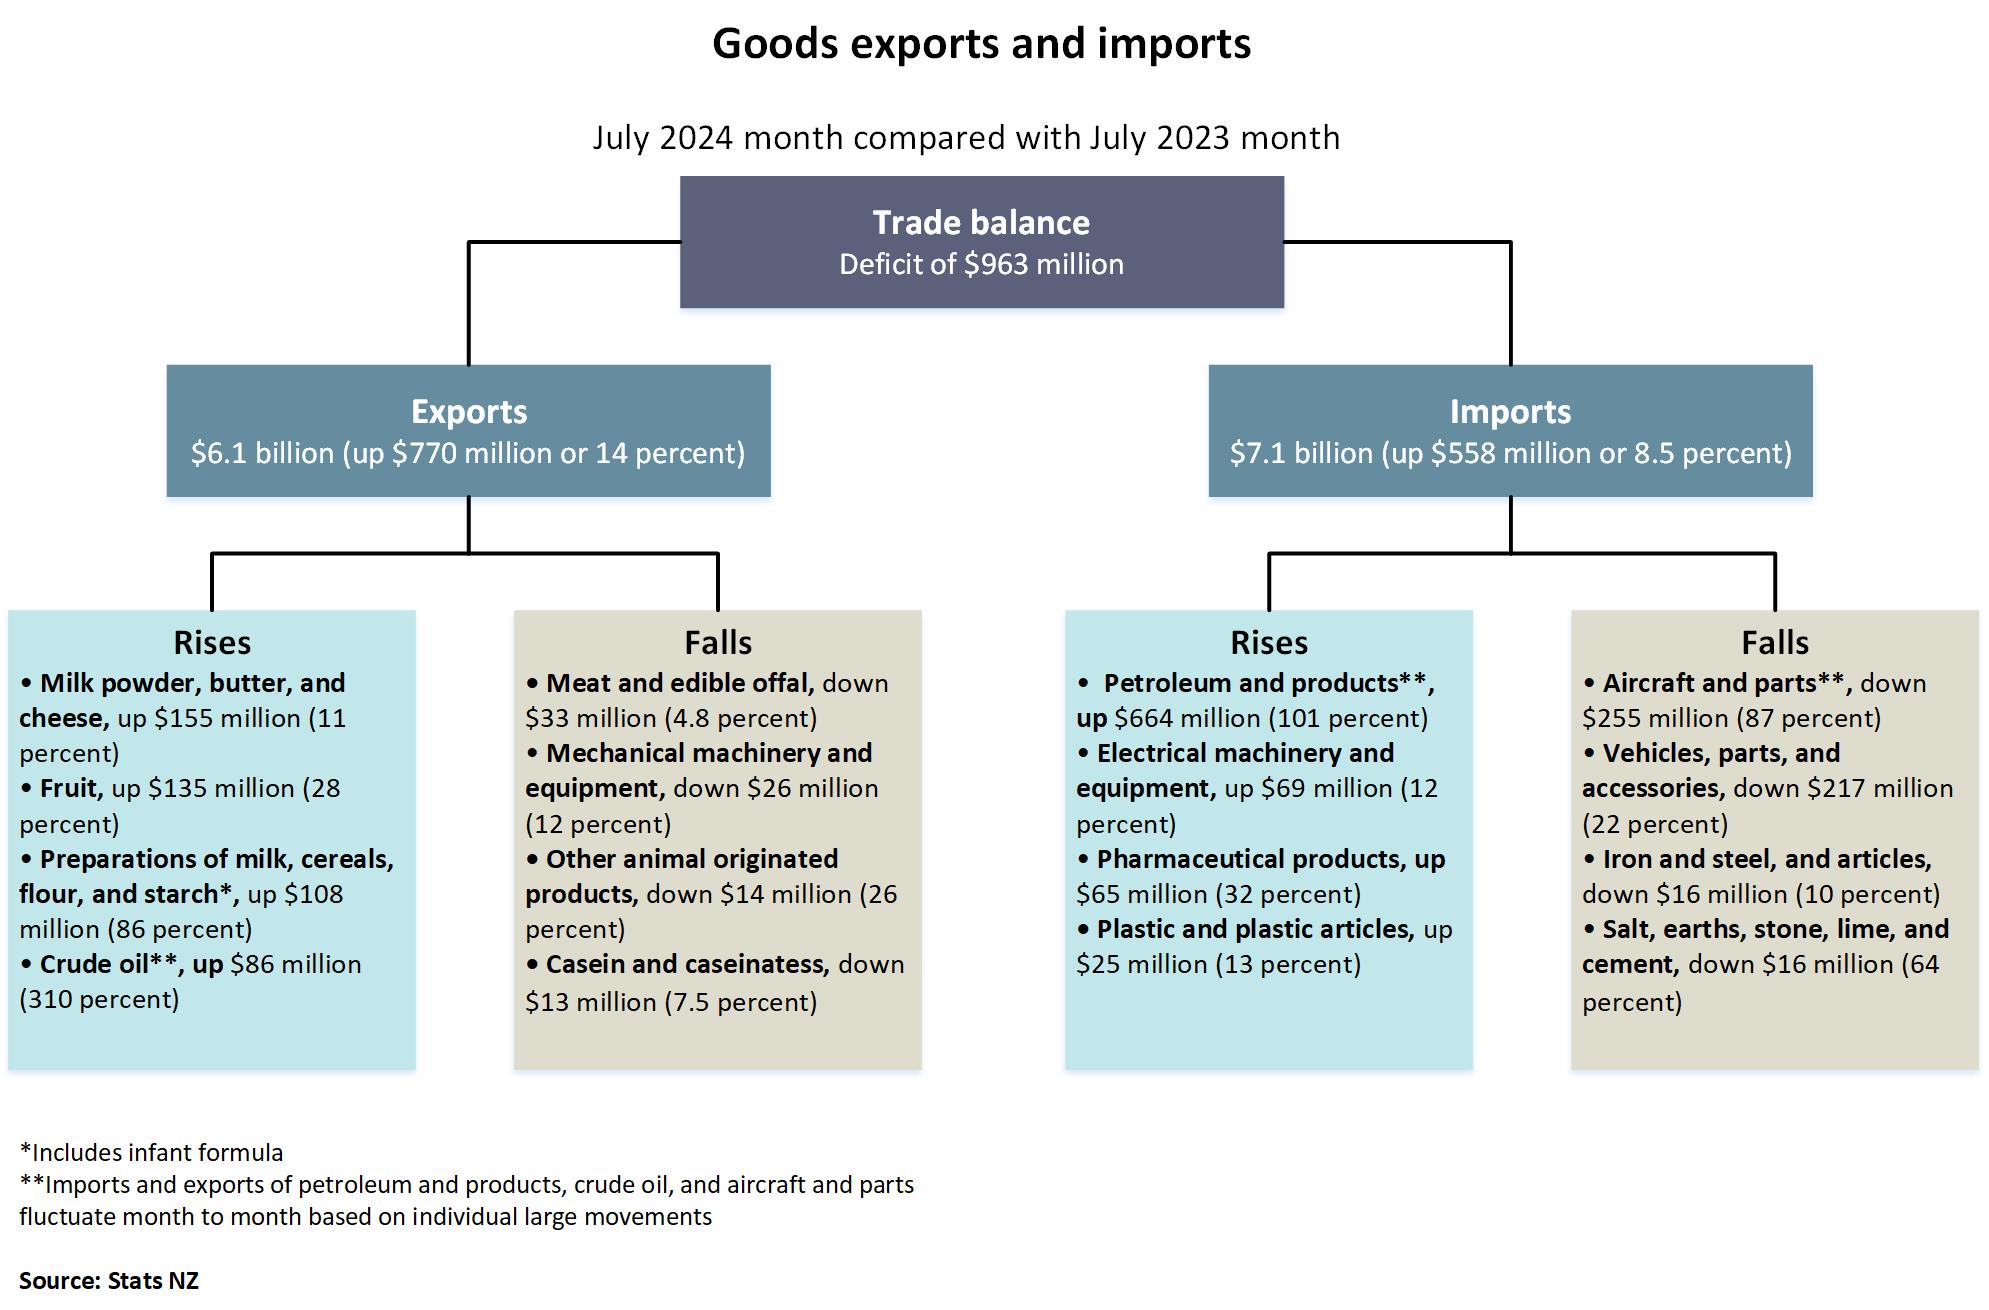
The diagram shows goods exports and imports for the July 2024 month compared with the July 2023 month.

The trade balance is a deficit of $963 million. This is the difference between exports valued at $6.1 billion (up $770 million or 14 percent) and imports valued at $7.1 billion (up $558 million or 8.5 percent).

Export commodities that rose included: milk powder, butter, and cheese, up $155 million (11 percent); fruit, up $135 million (28 percent); preparations of milk, cereals, flour, and starch*, up $108 million (86 percent); and crude oil**, up $86 million (310 percent).

Export commodities that fell included: meat and edible offal, down $33 million (4.8 percent); mechanical machinery and equipment, down $26 million (12 percent); other animal originated products, down $14 million (26 percent); and casein and caseinates, down $13 million (7.5 percent).

Import commodities that rose included: petroleum and products**, up $664 million (101 percent); electrical machinery and equipment, up $69 million (12 percent); pharmaceutical products, up $65 million (32 percent); and plastic and plastic articles, up $25 million (13 percent).

Import commodities that fell included: aircraft and parts**, down $255 million (87 percent); vehicles, parts, and accessories, down $217 million (22 percent); iron and steel, and articles, down $16 million (10 percent); and salt, earths, stone, lime, and cement, down $16 million (64 percent).

*Includes infant formula.
 **Imports and exports of petroleum and products, crude oil, and aircraft and parts fluctuate month to month based on individual large movements.

Source: Stats NZ

ISSN 1178-0320

Next release

Overseas merchandise trade: August 2024 will be released on 23 September 2024.

Related topics
Related releases