Post-enumeration survey: 2023
The Post-enumeration Survey provides the official measures of response, and coverage (undercount, overcount and net coverage), for each Census of Population and Dwellings. The coverage measures are used as key performance indicators for the relevant census, and provide a critical input for producing accurate population estimates and projections following the census.
15 April 2025: Several percentage values in Excel table 2 have been corrected to use the standard rounding rules for PES data – rounding to one decimal place.
The subheadings for tables 8 and 9 have been updated to more accurately describe the table content. Additionally, the descriptor for columns C–E in table 8 has been corrected to read ‘PES estimated population’.
Download data

Post-enumeration survey: 2023 – corrected 15 April 2025
Excel spreadsheet, 178 KB
Key facts
Coverage results from the 2023 Post-enumeration Survey (PES) showed that:
- the census counted 98.9 percent of people usually resident and present in Aotearoa New Zealand on census night, with a credible interval of 98.6–99.1 percent
- the national median estimated net undercount was 1.1 percent or 57,200 people
- there were 116,000 people not counted at all (gross undercount), and 58,800 people who were counted more than once or counted in error (gross overcount)
- the 2023 national net undercount rate of 1.1 percent was the lowest since coverage measurement began in 1996, and was down from the 2.6 percent net undercount recorded in the 2018 Census.
Coverage varied for different groups of the population:
- people of Māori ethnicity had a net undercount of 1.6 percent (14,400 people), compared with 1.6 percent for Pacific peoples (7,100 people), and 2.2 percent for people of Asian ethnicities (19,500 people)
- children (aged 0–14 years) had a slightly higher net undercount than the other age groups under 45 years, at 1.9 percent
- young adults (15–29 years) have traditionally had the highest net undercount by age group. However, in 2023, it was 1.4 percent, down from 4.7 percent in 2018. This was the largest decrease in net undercount across all age groups in 2023.
- males had a higher net undercount (1.5 percent) than females (0.8 percent) or people of another gender (0.6 percent). However, people of another gender had the highest level of uncertainty in this measure (credible interval: -2.4–3.8 percent). Data on gender was collected for PES for the first time in 2023. Gender collected for the first time in PES has more information on this.
- people born overseas had a higher net undercount (2.0 percent) than people born in Aotearoa New Zealand (0.8 percent)
- the North Island had a higher net undercount (1.2 percent) than the South Island (1.0 percent), due largely to the impact of the high undercount in the Auckland region
- the Auckland region, home to 33 percent of the population, accounted for approximately 42 percent of the net undercount
- across the 16 regions of Aotearoa New Zealand, the net undercount ranged from 0.5 percent in Hawke’s Bay to 1.4 percent in Auckland. Of all the regions, Hawke’s Bay had the highest level of uncertainty (credible interval: -0.7–1.8 percent).
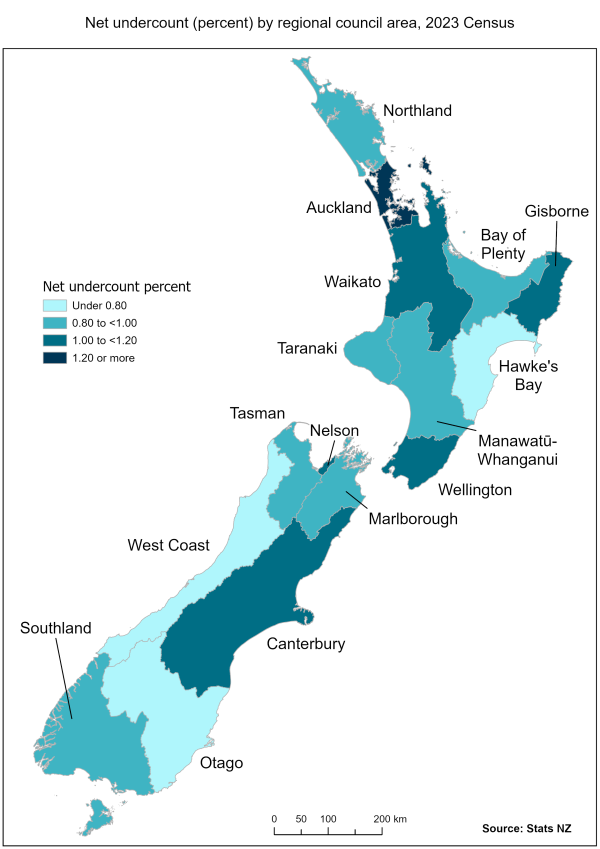
Text alternative for Net undercount (percent) by regional council area, 2023 Census
As well as measuring census coverage, the PES also provides the official measure of census response.
- In 2023 the census response rate was 87.6 percent, up from 85.8 percent in 2018. However, the 2023 response rate was below the response rates of 93.2 percent in 2013 and 95.1 percent in 2006.
- Response rates varied across different ethnic groups:
- 76.5 percent for Māori
- 79.2 percent for Pacific peoples
- 89.3 percent for Asian
- 89.9 percent for European.
About the Post-enumeration survey: 2023
The 2023 PES measures the completeness of the 2023 Census count. This allows population data produced after the census to be updated for people who are missed in the census, counted more than once, or counted in error, as measured by PES.
Coverage and response measures are used as key performance indicators for the 2023 Census, and the net census undercount is a critical input to the 2023-base estimated resident population (ERP).
The 2023 PES was carried out soon after Census Day (7 March 2023), with interviewers visiting approximately 16,500 private dwellings throughout Aotearoa New Zealand.
Survey collections were carried out in two waves due to extended census collections in the Auckland area.
- Wave 1: Collection took place in all regions except for Auckland between 2 June and 13 August 2023.
- Wave 2: Collection took place in the Auckland region between 1 July and 14 September 2023.
It is important to measure the quality of the PES itself. In 2023, the PES response rate was 89 percent, just below the 90 percent target. In comparison, the 2018 PES response rate was 91 percent.
In Aotearoa New Zealand, census counts are not adjusted directly to incorporate errors in counting identified by a PES. Not adjusting census counts is the most common practice internationally. Coverage measures, however, are used within Stats NZ to adjust the ERP which is used to derive post-censal population estimates and projections.
Gender collected for the first time in PES
The 2023 PES collected and produced data on gender information for the first time, in alignment with the data standard for gender, sex, and variations of sex characteristics.
Gender refers to a person’s social and personal identity as male, female, or another gender or genders that may be non-binary. This is different from previous iterations of PES when data was collected and produced on sex.
Data standard for gender, sex, and variations of sex characteristics has more information.
Text alternative for Net undercount (percent) by regional council area, 2023 Census
The map shows the net undercount percentages for each regional council area in the 2023 Census, categorised into four bands.
- Regional council areas with a net undercount percentage of less than 0.80 percent were: Hawke’s Bay, West Coast, and Otago.
- Regional council areas with a net undercount percentage greater than or equal to 0.80 percent but less than 1.00 percent were: Northland, Bay of Plenty, Taranaki, Manawatū-Whanganui, Tasman, Marlborough, and Southland.
- Regional council areas with a net undercount percentage greater than or equal to 1.00 percent but less than 1.20 percent were: Waikato, Gisborne, Wellington, Nelson, and Canterbury.
- The regional council area with a net undercount percentage greater than 1.20 percent was: Auckland.
Definitions and metadata
2023 Post-enumeration survey – DataInfo+ provides the general methodology used in these statistics.
Media enquiries
Sandi Reily
021 285 9191
media@stats.govt.nz
Technical enquiries
Joel Watkins
04 931 4600
info@stats.govt.nz
ISBN 978-1-991307-41-5