Aotearoa Data Explorer user guide
23 December 2024: We updated the Response format section of 'Using the API' to improve clarity and make the content easier to follow.
This guide aims to help users effectively navigate and use the Aotearoa Data Explorer.
Aotearoa Data Explorer is a free online tool that presents data in a searchable, flexible, and dynamic way. It is an interactive web browser interface where you can view, query, and download data.
You can watch our Aotearoa Data Explorer tutorial videos on YouTube to get a basic overview of how to search, customise, and download tables.
Disclaimer
Performance and availability may be impacted during periods of high use. Stats NZ monitors the service and will work to resolve any issues as soon as possible.
More information on the transition from NZ.Stat to Aotearoa Data Explorer, including timelines and available datasets, can be found on the Aotearoa Data Explorer page of our website.
Please note that not all Stats NZ data is available on Aotearoa Data Explorer, you can find out what data is available on Aotearoa Data Explorer here.
If you have feedback or questions, please contact info@stats.govt.nz.
Introduction
Tell us about yourself
Accessibility
About the data
Finding data
Exploring and downloading data
Metadata
Troubleshooting
Using the API
Introduction
Aotearoa Data Explorer is a tool that allows you to:
- search and discover detailed statistics about New Zealand’s economy, society, and environment
- filter and customise data to your own requirements
- generate custom tables and charts
- view detailed metadata alongside the data
- export data in a range of formats such as Excel and CSV
- bookmark and share your custom data tables
- automatically generate API calls to pull data into your own system.
Tell us about yourself
When you first arrive at Aotearoa Data Explorer, you will be presented with a pop-up box asking a question.
The ‘Tell us about yourself’ pop-up is a feature within Aotearoa Data Explorer, which allows you share a little bit about your background with us. By sharing this information, you help us design our products and services to suit you better.
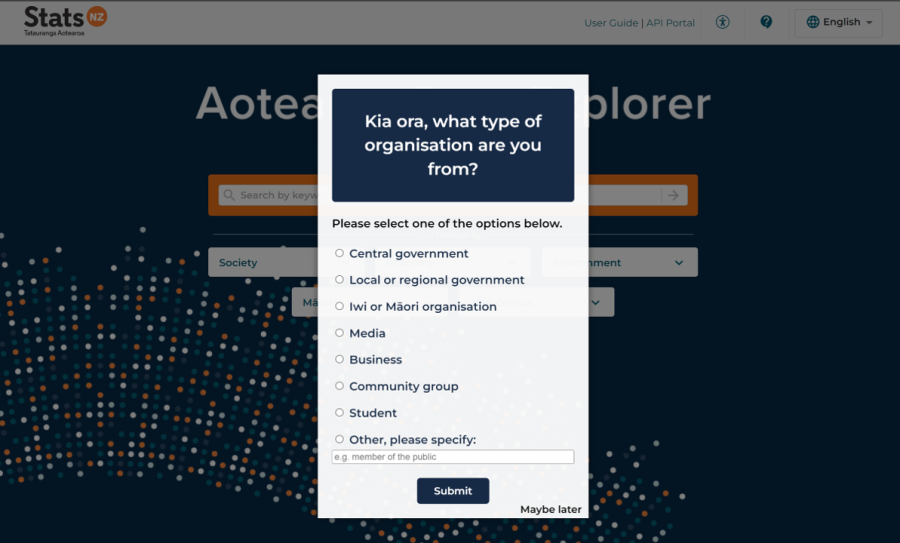
We aim to derive insights from the survey results to refine our data offerings and better align them with our customers’ needs.
Accessibility
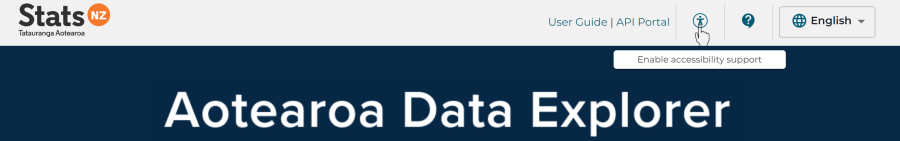
Aotearoa Data Explorer includes support for assistive technology such as screen readers. The 'Enable/Disable accessibility support' button activates and deactivates this feature. The button is located on the top right of the screen and is likely to be the first item a screen reader reads.
About the data
Aotearoa Data Explorer organises data in the form of dataflows. Each dataflow is a multi-dimensional dataset. Dimensions are axes on which the data is described, for example, year, age, sex, ethnic group, and area unit.
Every dimension contains a pre-defined list of items, called dimension members. In the ethnic group dimension, for example, the dimension members are the different ethnic groups.
Aotearoa Data Explorer includes metadata that provides information about the data you are viewing.
Finding data
There are two methods for finding data using Aotearoa Data Explorer:
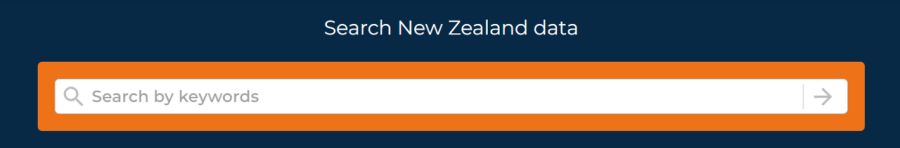
- search for data by entering keywords in the search field on the homepage
- browse for data by expanding a topic under the 'browse by' option.
Search for data
Data can be searched by using one or several keywords, or exact phrases in the search box. Exact phrases must be entered within double quote marks, for example, “ethnic group”.
When entering multiple keywords, the search result will include all dataflows that exactly match any one of the keywords or the exact phrase in the table title, dimensions, filters, and overview information. Because of this enhanced search capability, it’s important to be careful when reviewing search results and selecting tables.
When search result is a dimension
If the keyword or exact phrase is a unique dimension, clicking on a table title in search results will show filtered data relating to this dimension. For example, searching for ‘Christchurch’ will show Christchurch as a dimension as shown in the image below.
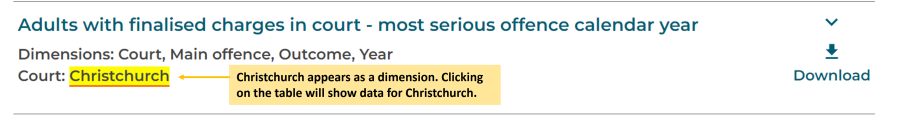
Clicking on this table will show Christchurch in the filter list, filtering the data automatically.
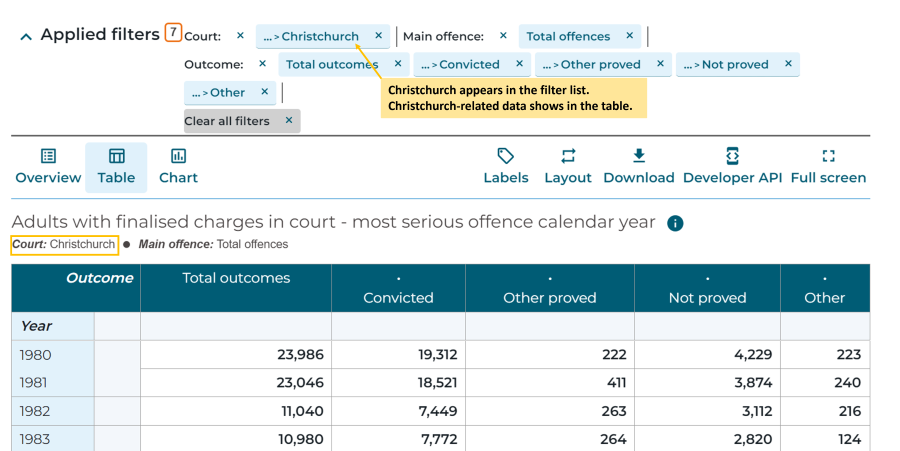
Image shows filtered list for 'Christchurch' in Aotearoa Data Explorer.
When search result is not a dimension
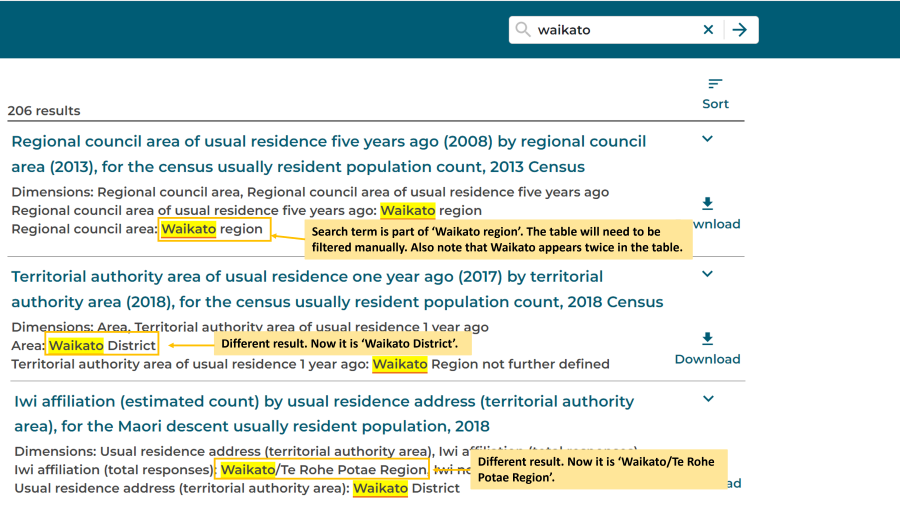
If the keyword or exact phrase is part of a dimension, the keyword appears in multiple places within the table. This means your keyword or phrase is not a dimension. In these cases, the table will show the default view, such as data at the New Zealand level. You will need to filter the table manually by using the table level filter on the left side of the screen to select the specific data you are interested in (see Filtering the data).
For example, if you use ‘Waikato’ as a keyword in the search box, you will get Waikato Region, Waikato District, and others returned. In the search results list, Waikato appears as part of a phrase.
If you then click on a table, for example, ‘Regional council area of usual residence five years ago (2008) by regional council area (2013), for the census usually resident population count, 2013 Census’, Waikato region does not appear in the filter list and is not selected in the ‘Regional council area’ filter.
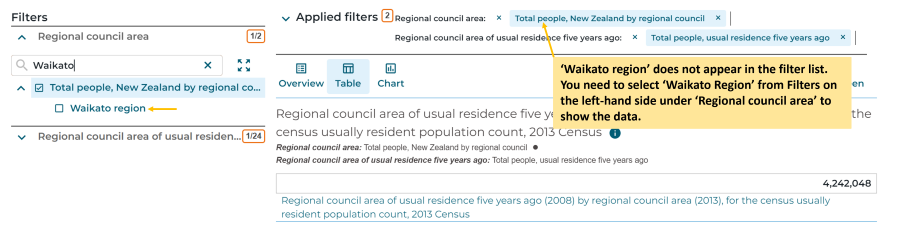
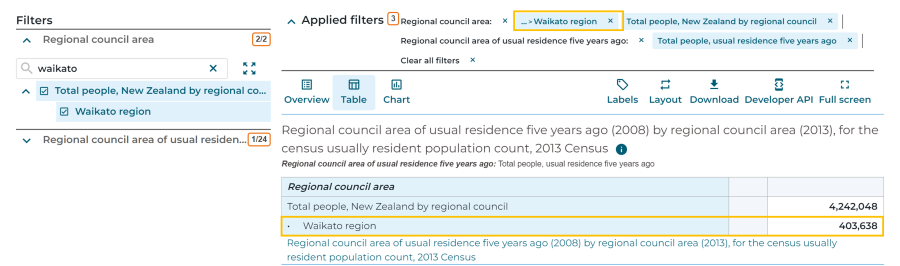
You need to manually select ‘Waikato Region’ from the filter on the left-hand side under ‘Regional council area’ to get the data to display in the table.
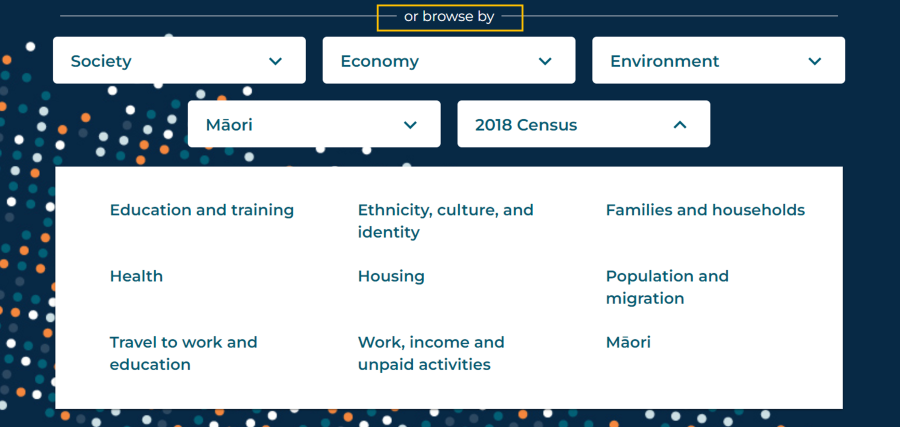
Browse for data
Use the 'browse by' menu to browse for data.
Select a topic from the dropdown list. The topic will expand to show subtopics in the box below.
Refine your selection
On the search results screen, use the 'Filters' menu on the left to locate the specific data you want. Any additional filters you select will be automatically applied when viewing the data.
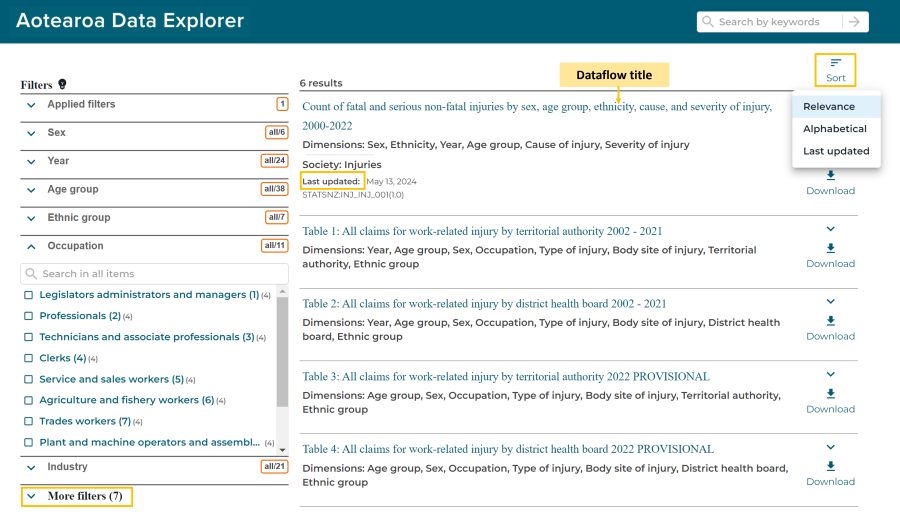
The number of filters displayed is limited. Select 'More filters' below the list to see them all.
Use the down arrows to expand and select. For example, under ’Occupation’, you could filter for a particular job classification to view results that include data for only that job classification.
You can search within each of these filters and apply as many filters as you want.
Your results will be automatically updated when you add or remove filters.
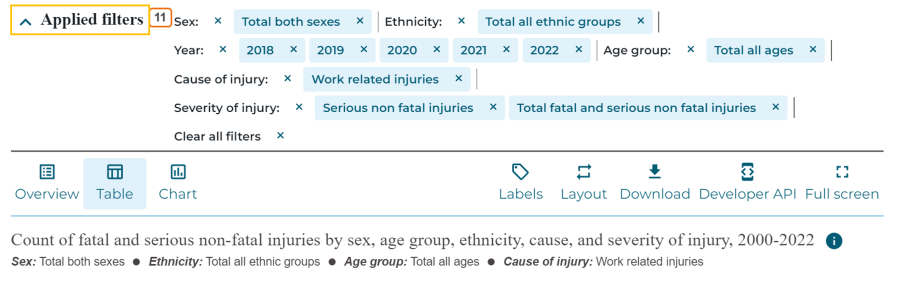
To remove a filter, expand 'Applied filters' at the top of the Filters menu and click ‘x’ to remove one or all filters.
In the results list you can expand the overview of the dataflow to see the dimensions, categorisation(s), and last updated date.
Use the 'Sort' function to sort your results by relevance, alphabetical, or by last updated. Click on the 'Sort' button in the top right corner.
To view data, click the dataflow title in search results.
Exploring and downloading data
Filtering the data
When you open a dataflow, a default data view will be displayed. Use the 'Filters' menu on the left of the screen to select the data you need.
Each section of the filter menu represents a dimension in the dataflow. Each dimension includes one or more dimension members.
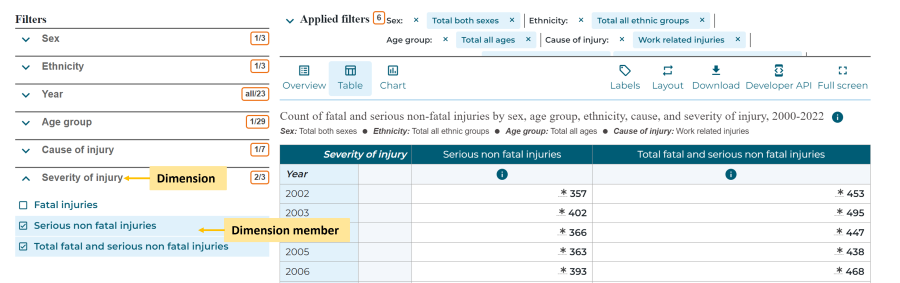
Select or unselect dimension members to choose what data is included in your table. Use the down arrows to expand the list of available members for each dimension in the filter menu.
Click a dimension member to add it to the filter list, click it again to remove it from the filter.
If no members are selected for a dimension, the filter will include all members by default.
You can search within a dimension to find specific dimension members ‒ this is particularly useful for large dimensions.
Your view of data will automatically update every time you change the filter.
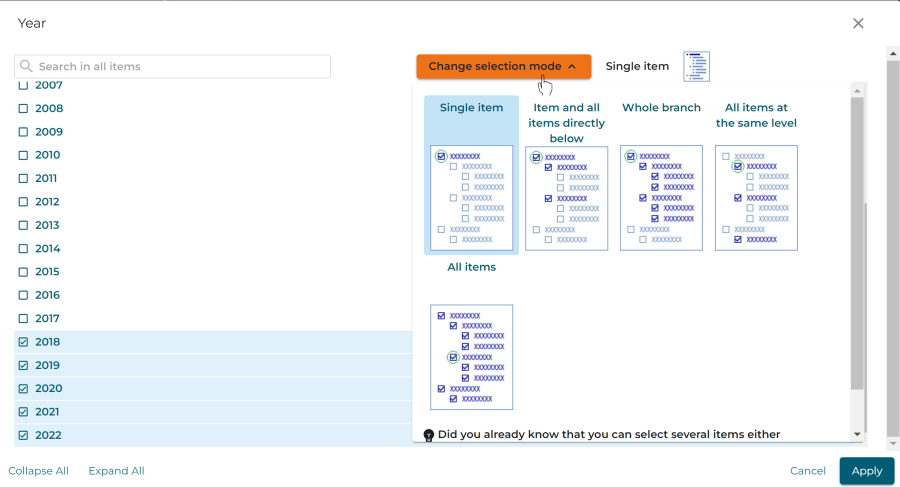
Use advanced selection modes to select multiple items at once. You can select an entire level of the dimension hierarchy. You can also select the entire hierarchy level or the entire currently displayed list.

To change the selection mode, click on the 'Change selection mode' button (available in the 'Advanced selection' menu), then use the options shown in the pop-up below. Your view of the data will update when you click the 'Apply' button.
Expand the 'Applied filters' menu to see all currently applied filters. You can remove some or all filters for each dimension here.
Customising the data view
Click on the 'Layout' button at the top of the table display to customise your table layout. You can drag dimensions between columns, row sections, and rows.
Check the preview of your table to see how the changes would look and then click ‘Apply layout’ to update and save your customised data table.
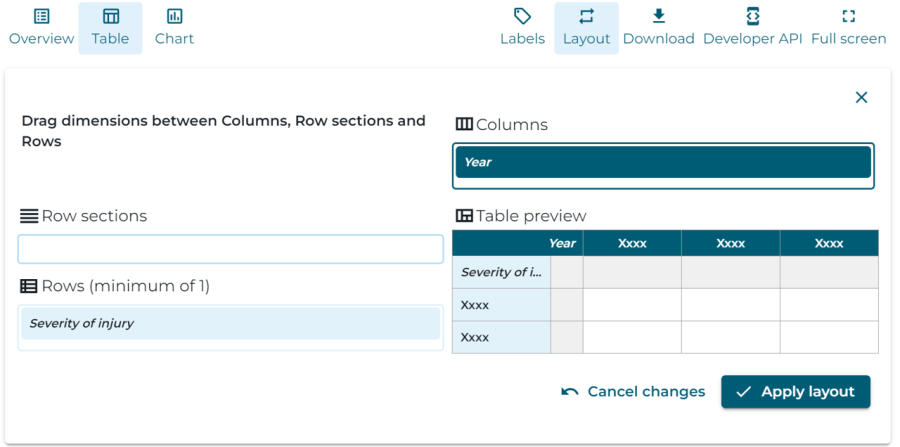
Chart function
You can also visualise data in Aotearoa Data Explorer using the chart function.
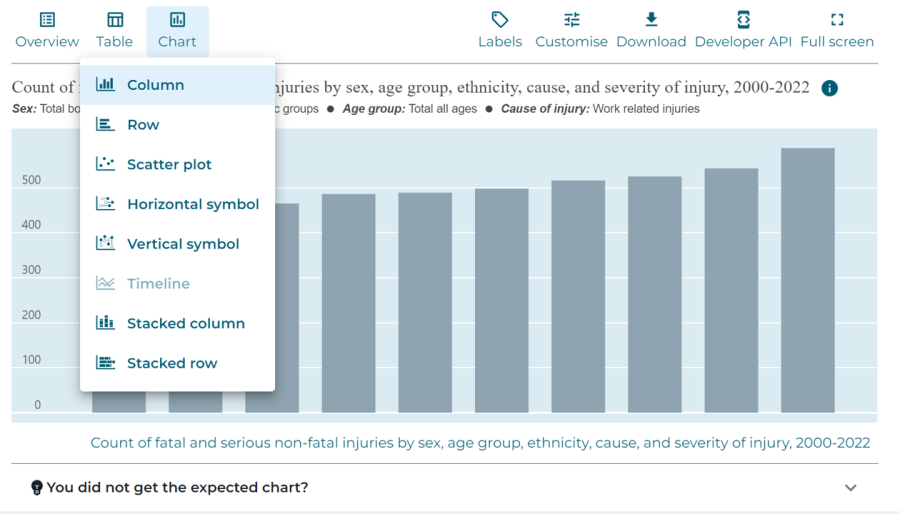
Click 'Chart' above your table title and select the type of chart you wish to view.
Use the 'Filters' menu to select the data you wish to visualise.
The 'Customise' menu provides options to customise the look and functionality of your chart. This includes chart size, axis values, and highlighting data.
Use the 'Download' button to download your chart as a picture.
Expand the 'You did not get the expected chart?' section below the chart for chart-specific help in Aotearoa Data Explorer.
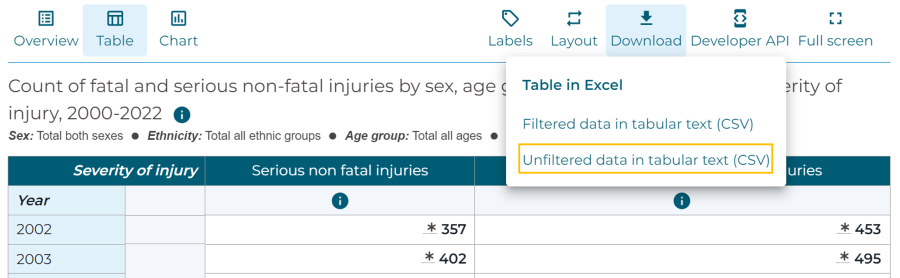
Downloading data
You can download data from Aotearoa Data Explorer as Excel, filtered CSV, and unfiltered CSV files.
Table in Excel ‒ download an Excel XLSX file with the same view of data as your Aotearoa Data Explorer table.
Filtered data in tabular text (CSV) ‒ download a comma separated values (CSV) file with the data you selected for your Aotearoa Data Explorer table.
Unfiltered data in tabular text (CSV) ‒ download a comma separated values (CSV) file with all data for the selected dataflow. Note: This may take a long time for some large datasets (see Download unfiltered CSV files for very large datasets) if you encounter any issues.
Metadata
Where to find metadata
Metadata for a table is available at the following levels:
- dataflow
- dimension member
- observation.
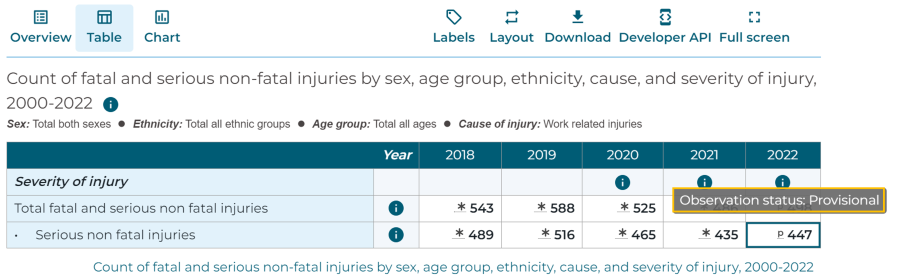
If metadata is available, an (i) icon or (*) appears next to or under the corresponding level.
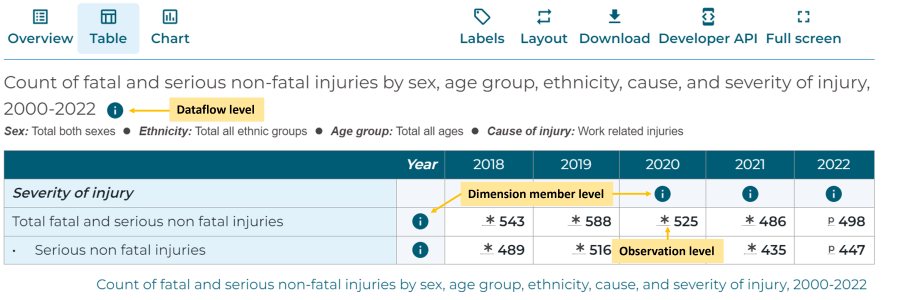
Dataflow level
Click on the (i) icon next to the table title to see information about the table in a side panel.
Note: Metadata at dimension level is now included at this dataflow level, for example, metadata is available here for sex, ethnicity, year, age group, cause of injury, and severity of injury.
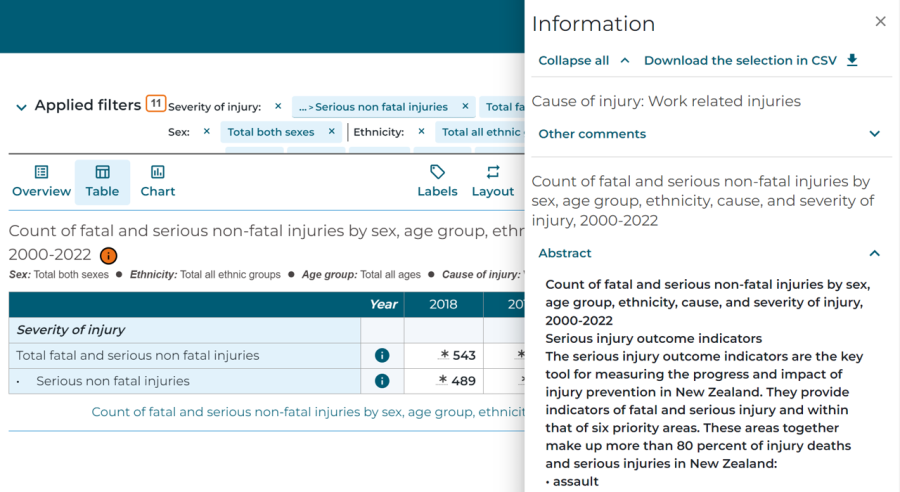
Dimension member level
Click on the (i) icon at the dimension member level to see information about the dimension member in a side panel.
Note: The dataflow information will be displayed below the dimension member information in the side panel.

Observation level
Hover your mouse over a cell to see metadata for observation level.
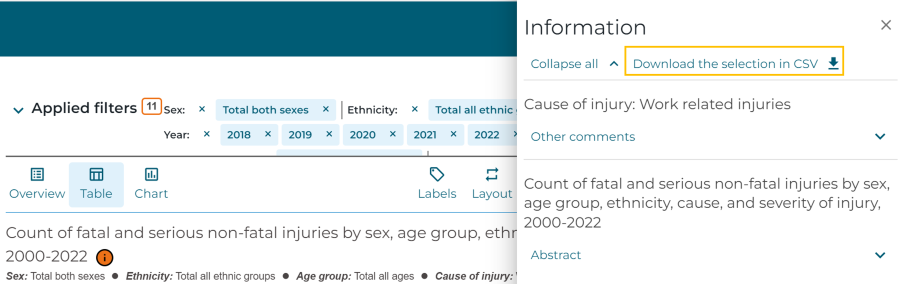
Downloading metadata
Currently the metadata can only be downloaded in HTML format within a CSV file.
To do that, click the ‘Download’ button in the information panel.
Troubleshooting
Empty table cells or missing rows and columns
Aotearoa Data Explorer cannot display more than 8,000 data points in a table. If you exceed this limit, some cells in the table may appear empty, even though data is available, or the table may not include all rows or columns. A warning (highlighted in orange) next to the title will alert you if you exceed the 8,000 data point limit.

We recommend you download the full dataset as a CSV by clicking 'Unfiltered data in tabular text (CSV)'.
Alternatively, you can use filters to reduce your data selection to below 8,000 data points. Use the 'Filters' menu on the left to select less data, for example, to reduce the number of time periods or age group selected. See Filtering the data for more information.
Download unfiltered CSV files for very large datasets
‘Download unfiltered data in tabular text (CSV)' may take a long time if the dataflow has a large amount of data or due to other factors such as internet speed and device capabilities.
A large file with 71 million observations could be around 14GB and can take many minutes to download.
For example:
- 344,000 observations download a 42.5MB file in approximately 2 mins
- 24 million observations download a 3.35GB file in approximately 20 mins.
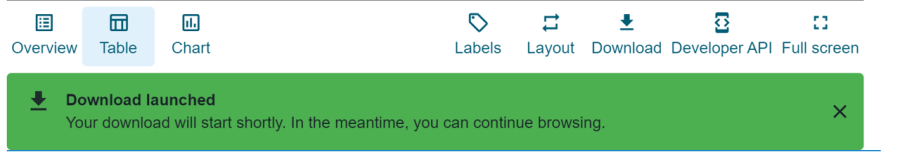
During the download process, a warning message will be displayed – you can close this warning and continue interacting with Aotearoa Data Explorer.
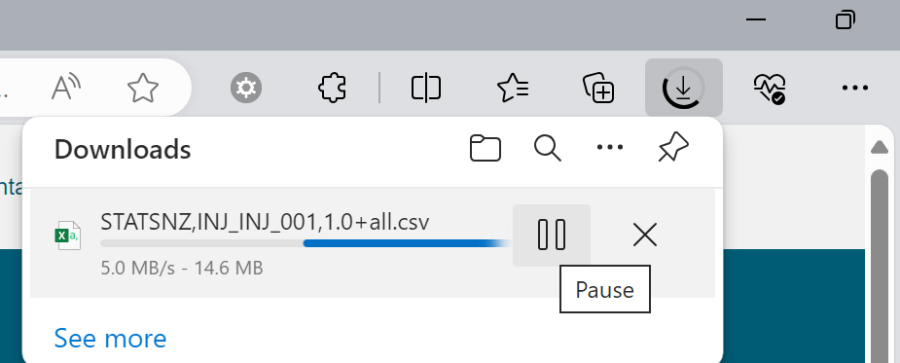
Progress of the download can be viewed in the normal way depending on your browser. For example, in Microsoft Edge, you can select ‘Download’ next to the browser search bar. Alternatively, you can check your ‘Downloads’ folder in Windows File Explorer.
You can use filters to select a subset of all data and download this as ‘filtered data in tabular text (CSV)’.
If there is a connection failure during the download, a ‘Network Error’ will be reported. Download needs to be restarted once connection is restored.
URL too long for a large selection of filters
The URL of a table contains the current filter selection so that the table view can be shared and bookmarked as viewed on screen. If too many filters are selected at once, the URL becomes too long to be shared or bookmarked and a warning message pops up:
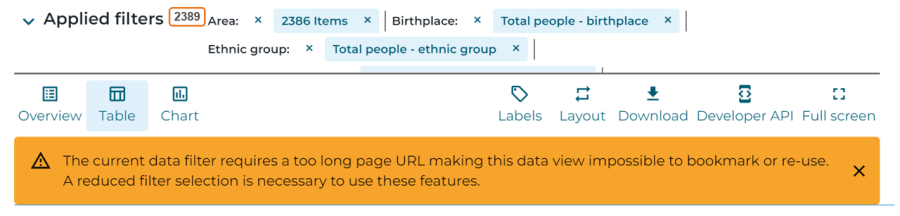
The table URL will not be accessible when this message appears, and an error message will display when attempting to access the table URL, for example, accessing the table URL on Chrome will display ‘This site can’t be reached’. However, data can still be downloaded as unfiltered CSV. If you wish to share or bookmark the table URL, the filter selection will have to be reduced.
Using the API
Introduction
All statistics in Aotearoa Data Explorer are also available via Application Programming Interface (API). The Aotearoa Data Explorer API is based on the SDMX standard and allows a developer to programmatically access the data using simple RESTful URL and HTTP header options for various choices of response formats including JSON.
Stats NZ strives to maintain availability of the API, but we cannot guarantee uninterrupted service. The performance and availability of the API may be affected during periods of high usage, maintenance activities, or unforeseen technical issues. In the event of any issues, Stats NZ will work to resolve them as soon as possible.
The API service may be subject to change.
Authentication
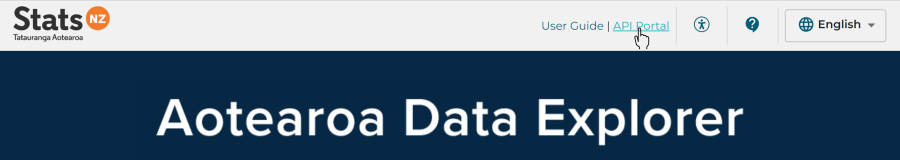
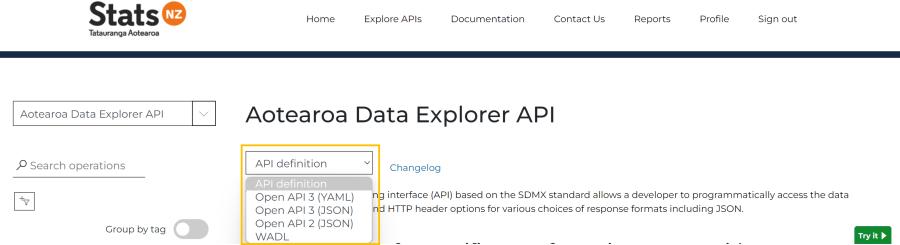
To use the Aotearoa Data Explorer API please visit the API Portal and sign up for an account. By registering, you will be able to subscribe to the Aotearoa Data Explorer ‘Product’ and generate subscription keys for your API calls.
Your account will allow you to view, manage, and monitor your subscription keys, including revoking or regenerating keys as needed.
Furthermore, the portal provides API usage reports, enabling developers to monitor their data consumption and optimise their usage patterns. This all-in-one platform is tailored to meet the needs of developers seeking to leverage the powerful data resources available through the Aotearoa Data Explorer API. Developers can effectively integrate the Aotearoa Data Explorer product into applications, leveraging its data extraction capabilities to streamline workflows.
For detailed documentation and additional resources, please visit the Documentation section in the API Portal.
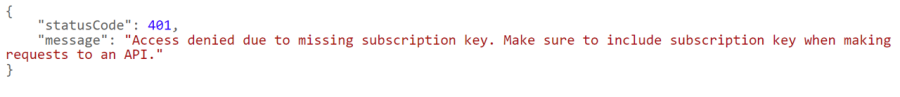
When making API calls from your applications and systems, you will need to provide your subscription key in the HTTP request header ‘Ocp-Apim-Subscription-Key’.
If making API call without the subscription key, ‘status code: 401’ will be reported.
Generating API calls
The Aotearoa Data Explorer REST API enables you to access Stats NZ data in Aotearoa Data Explorer via API GET requests.
Base URL
This service only responds to a single GET method: https://api.data.stats.govt.nz/
URL templates
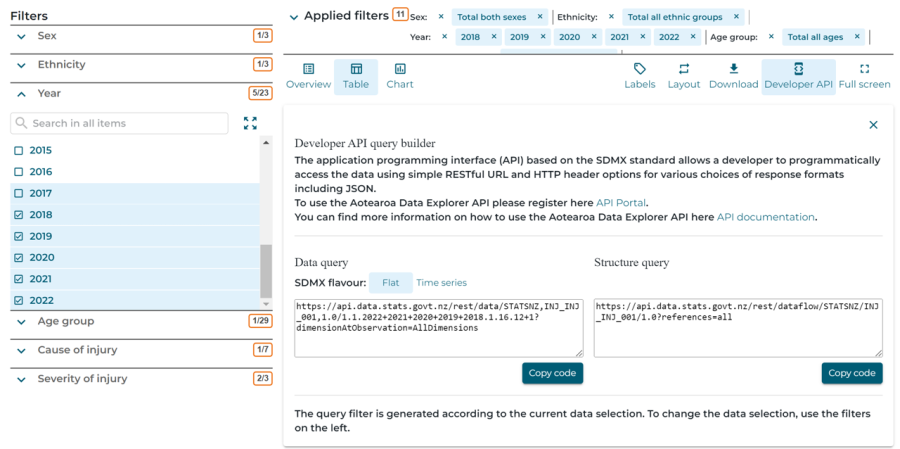
Aotearoa Data Explorer generates API query templates for the data selected in your table.
Select 'Developer API' at the top right of the screen to view API queries for your selection.
- 'Data query' will return the exact data from your Aotearoa Data Explorer table.
- 'Structure query' will return the structural metadata for the table you are viewing.
Request format
You can customise your API query to return the data or metadata you are interested in and in the format you want.
The Aotearoa Data Explorer REST API is fully compliant with SDMX 2.1 – the Statistical Data and Metadata Exchange information model . The SDMX-REST Guide is available on GitHub.
Data and metadata collected from SDMX APIs can be retrieved using different syntaxes, by specifying the appropriate parameters. Different types of SDMX content that can be retrieved:
- data
- structural metadata.
Here is a quick reference description of the most frequently used syntax and parameters for the SDMX API derived from the full SDMX cheat sheet of the SDMX RESTful API 1.5 standard with examples added in the Aotearoa Data Explorer context and unsupported elements removed.
Legend: Mandatory path parameter / Optional path parameter / Query string parameter (all optional)
Data queries
https://api.data.stats.govt.nz/rest/resource/flowRef/key?queryStringParameters
|
Parameter |
Description |
Default |
|
Mandatory path |
https://api.data.stats.govt.nz/rest/resource/flowRef |
|
|
resource |
data |
|
|
flowRef |
Dataflow reference in a format AGENCY,ID,VERSION (for |
|
|
Optional path |
/key |
|
|
key |
Query coordinates of the data. The coordinates are the |
|
|
Query string |
?queryStringParameters |
|
|
dimensionAtObservation |
The Id of the dimension attached at the observation level. Options are:
|
AllDimensions |
|
detail
|
Desired amount of information to be returned. |
full |
Structural metadata queries
https://api.data.stats.govt.nz/rest/resource/agencyID/resourceID/version?queryStringParameters
|
Parameter |
Description |
Default |
|
Mandatory path |
https://api.data.stats.govt.nz/rest/resource |
|
|
resource |
The type of artefact to be returned. Values: datastructure, categoryscheme, conceptscheme, |
|
|
Optional path |
/agencyID/resourceID/version |
|
|
agencyID |
Agency maintaining the artefact (for example, STATSNZ) |
STATSNZ |
|
resourceID |
Artefact ID (for example, AGR_AGR_002) |
|
|
version |
Arterfact version (for example, 1.0) |
1.0 |
|
Query string |
?queryStringParameters |
|
|
detail |
Desired amount of information. Values: allstubs, referencestubs, referencepartial, full |
full |
|
references
|
References to be returned with the artefact. Values: none, all, any type of resource |
all |
Response format
Data is available in XML, JSON, and CSV.
Metadata is primarily available in XML. Some metadata is also available in JSON – you can view the availability of this in the API definition on the Aotearoa Data Explorer API product page in the API portal.
You can specify the response in the API URL using the ‘format’ query parameter:
- XML: ‘format=xml’
- Structure-specific XML (good for time series): ‘format=structurespecificdata’
- JSON: ‘format=jsondata’
- CSV: ‘format=csvfile'